When trying to understand the effect changing the temperature parameter on the output of a Large Language Model, the explanation is often that “it makes the model responses more creative” and, if you know that the model works by looping over predictions for the next token, that explanation can feel a bit underwhelming, so here’s a slightly longer one.
What happens is that the model generates a score for each possible next token, which is then transformed into probabilities, and the next token is sampled from those probabilities. While the top-k parameters means that the next token will be sampled from the k top tokens by score, temperature changes the probability distribution created from those scores.
While a temperature of 1.0 means the probabilities are a direct reflection of the scores, higher temperatures flatten those probabilities, increasing the chances of tokens that would be less likely to be selected, and discretion that of the most likely ones - leading the model to output less common tokens more often, making it more “creative”.
Conversely, temperatures below 1.0 makes the chance of those tokens more likely to be selected even larger, making the model more predictable.
To help understand how changing temperature and top-k affect probabilities, I’ve put together this visualization.
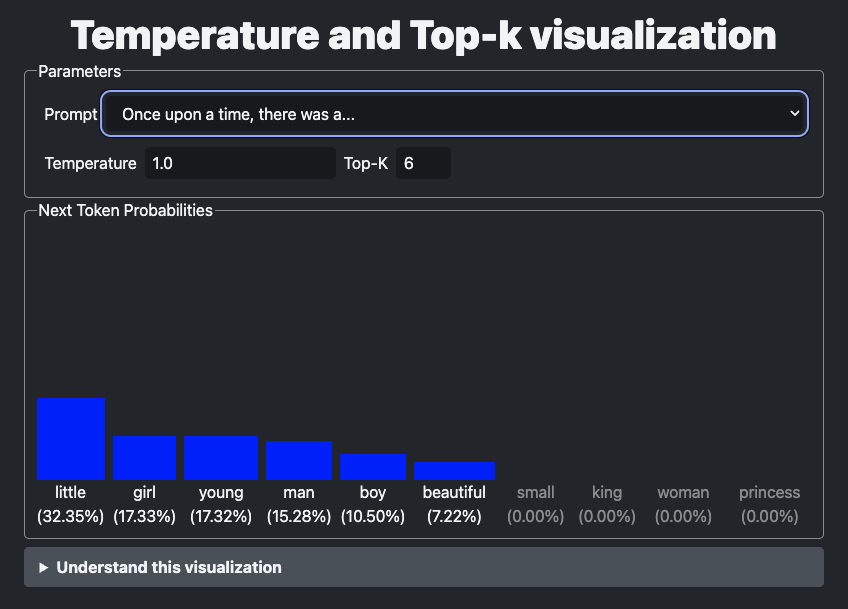
The visualization shows the 10 highest score next tokens for a few different prompts and the bars show the probability of each token being selected.
When changing the temperature up or down, you can observe how the probabilities are flattened out or become sharper, and how changing top-k drops some of the potential next tokens altogether.
Check out the visualizer at https://andreban.github.io/temperature-topk-visualizer/!
Comments
No comments yet. Be the first to comment!
Leave a comment
Comments are moderated and may take some time to appear.